How to Remove Chlorine Taste from Water: Your Ultimate Filtration Guide
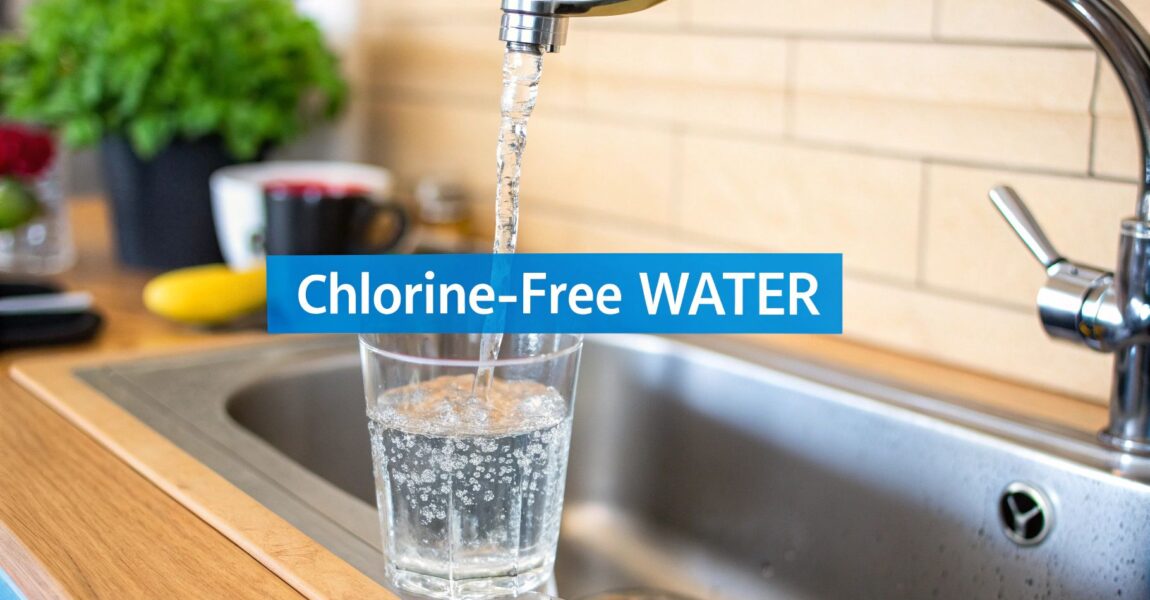
Let's cut to the chase. If your tap water tastes like it just came from the local swimming pool, the hands-down best solution is a home water filtration system. More specifically, you need a filter armed with activated carbon. Think of activated carbon as a highly-effective bouncer for your water—it grabs the chlorine molecules and doesn't let them go. The result? Pure, crisp, and delicious water flowing right from your faucet.
Why Your Tap Water Tastes Like a Swimming Pool
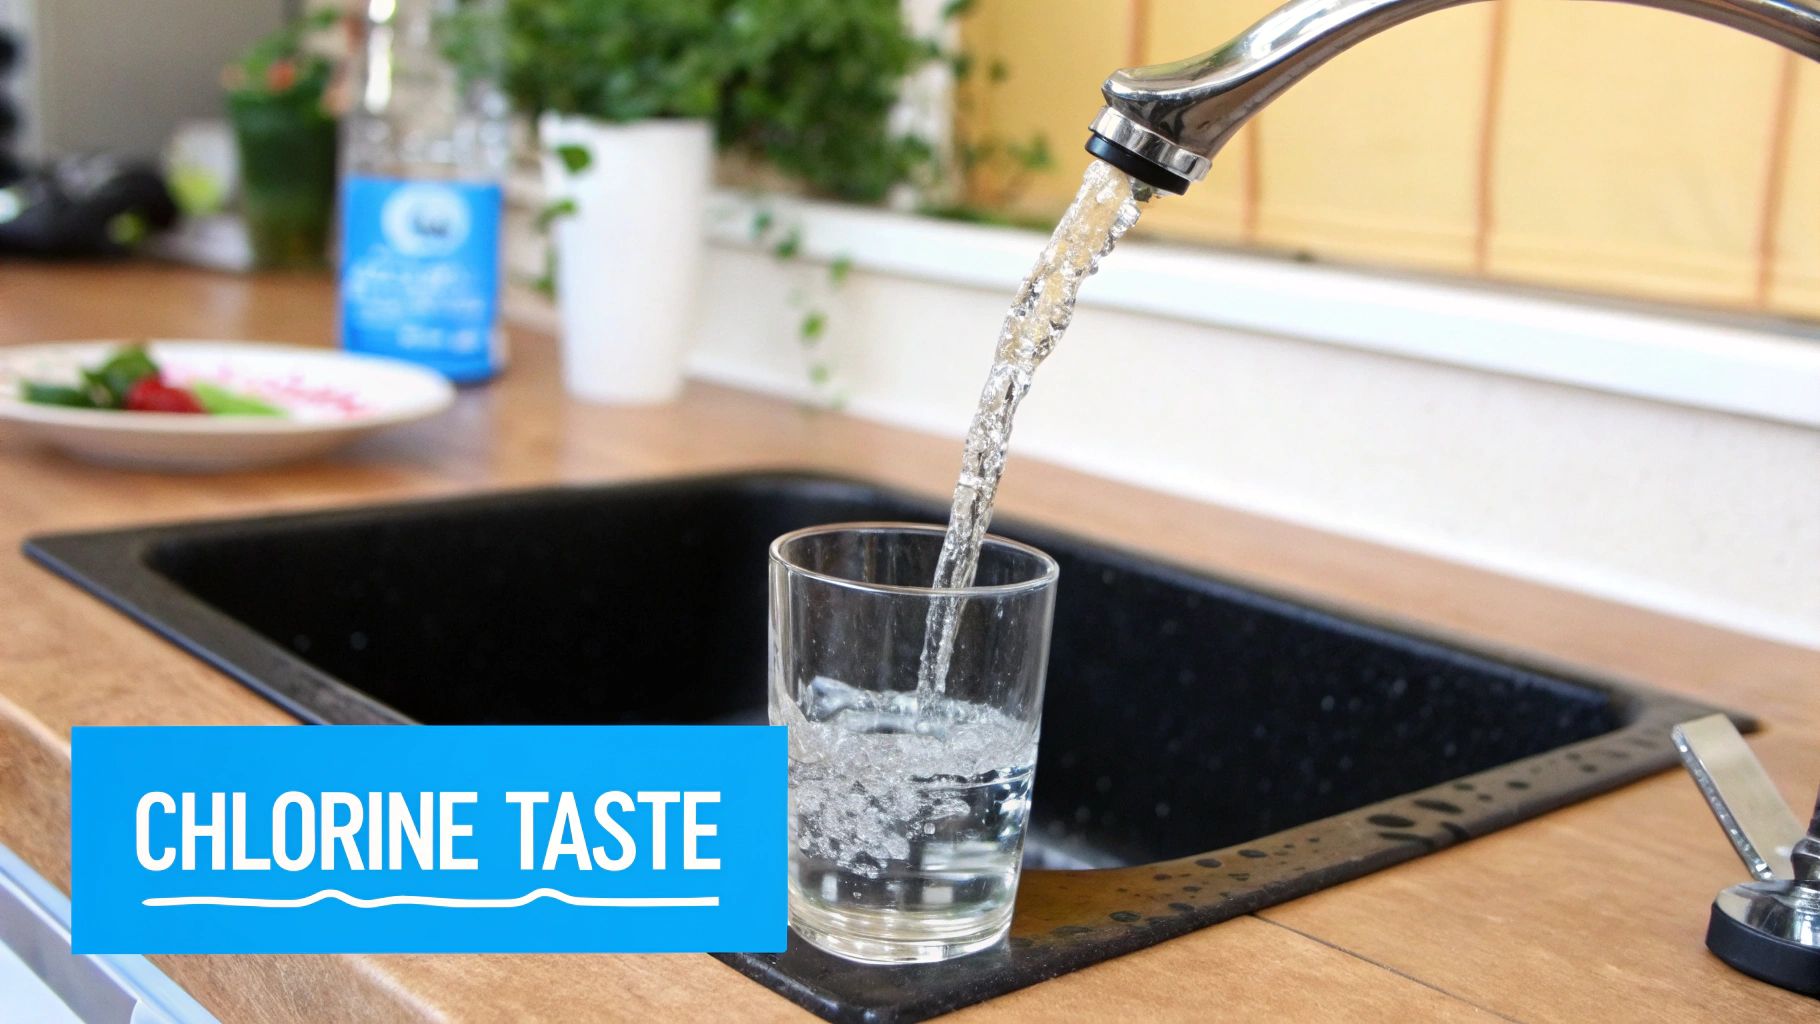
If you’ve ever filled a glass from the kitchen sink only to be greeted by a chemical whiff, you're not alone. That distinct smell and taste come from chlorine, a disinfectant that municipal water treatment facilities add to our drinking water. It’s a true public health hero, working tirelessly behind the scenes to annihilate nasty bacteria and viruses before they ever reach your tap.
Since its debut back in 1908, chlorination has practically wiped out devastating waterborne diseases like typhoid and cholera. So it’s no surprise that a massive 98% of U.S. water treatment plants still rely on it to keep our water safe during its long journey to our homes. It works like a charm, but that distinct aftertaste is the price we pay.
Your Taste Buds Don't Lie
According to the Environmental Protection Agency (EPA), chlorine levels up to 4 milligrams per liter (mg/L) are considered perfectly safe to drink. But here's the kicker: our palates are incredibly sensitive. Most of us can detect the taste and smell of chlorine at levels as low as 0.3 mg/L—far below the official safety limit. This is precisely why the world of home water filtration has become so popular.
This sensitivity explains the boom in the home water filter market. An estimated 77% of Americans now use some kind of home water filter, with kicking that chlorine taste to the curb being a primary motivator. Our friends at Sensorex have a fantastic deep dive on chlorine in drinking water if you want to geek out on the science.
Here's the fantastic news: You don't have to choose between safe water and great-tasting water. Modern filtration systems are engineered to remove the unpleasant chlorine taste after it has already done its crucial job of protecting the water supply.
In this guide, we're diving deep into the most effective and hassle-free solution for any homeowner: water filtration. We’ll show you how simple, affordable filter systems can completely transform your tap water, leaving you with pure, delicious H2O for drinking, cooking, and everything in between.
Simple Fixes vs. Lasting Filtration Solutions
You’ve probably heard the old wives' tales for ditching the chlorine taste. Maybe you've tried letting a pitcher of water sit out on the counter (a method called aeration) or even boiling it before drinking. And sure, these can help a bit in a pinch by allowing some of the chlorine gas to dissipate.
But let's be real—who has the time or patience for that circus every day? These aren't genuine solutions; they're temporary hacks. They're inefficient, the results are inconsistent, and frankly, they're a total pain. If you want consistently pure-tasting water on demand, a home water filtration system is the only way to go. It’s not a daily chore; it’s a permanent upgrade for your home and your quality of life.
Why Temporary Tricks Just Don't Cut It
Boiling and aerating your water might seem like a clever workaround, but they fall completely flat for everyday use. Boiling takes time, wastes energy, and leaves you waiting for the water to cool. Aeration can take hours to make a noticeable difference, all while your water sits out, collecting dust and soaking up stray kitchen odors.
These makeshift methods can't hold a candle to the reliability of a dedicated filtration system. A quality filter is a true set-it-and-forget-it solution, working silently in the background to deliver incredible-tasting water without you lifting a finger.
Making the Upgrade to a Real Solution
Choosing a filtration system is about embracing convenience and effectiveness. Chlorine is a powerful disinfectant, and while the EPA says levels up to 4 parts per million (ppm) are safe, most of us can taste it at far lower concentrations. There's a reason why by 2022, over 77% of Americans were already filtering their tap water—and that number keeps climbing. For a closer look at public water treatment, the CDC offers some great info on water disinfection practices.
The mission isn’t just to mask the chlorine taste now and then; it’s to eliminate it for good. A filtration system ensures every single glass you pour is fresh, clean, and completely free of that swimming pool tang.
This is where we say goodbye to temporary fixes and hello to permanent upgrades. The best part? There’s a huge range of filtration options out there to fit any home, budget, or lifestyle. Some of the most popular choices include:
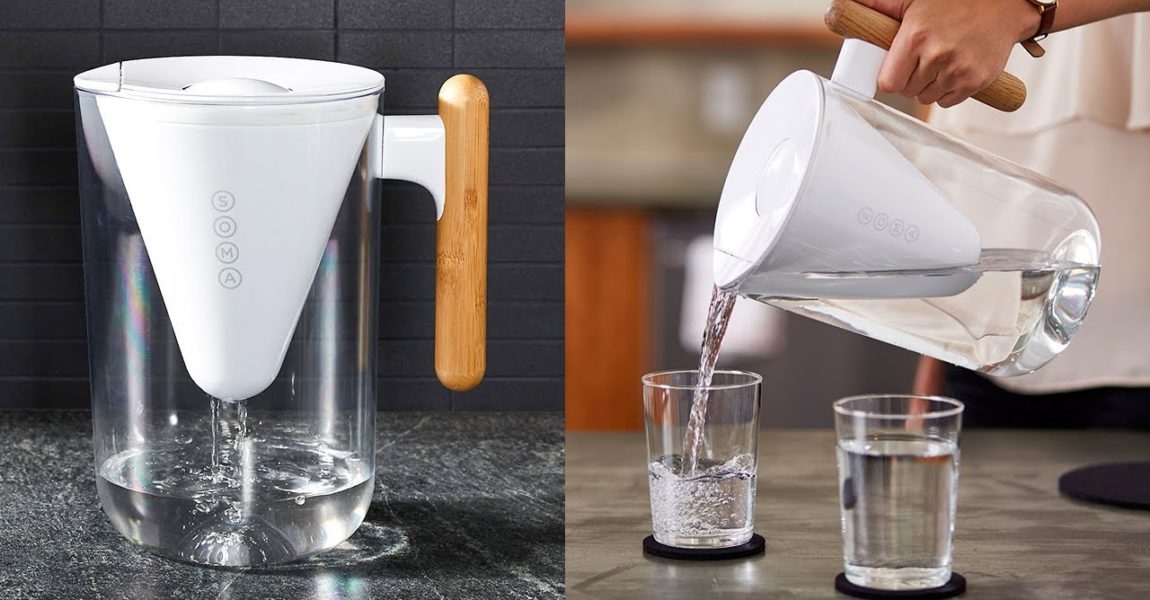
- Water Filter Pitchers: Simple, affordable, and a perfect entry point for individuals or small households.
- Faucet-Mounted Filters: Incredibly easy to install, giving you filtered water with the flick of a switch.
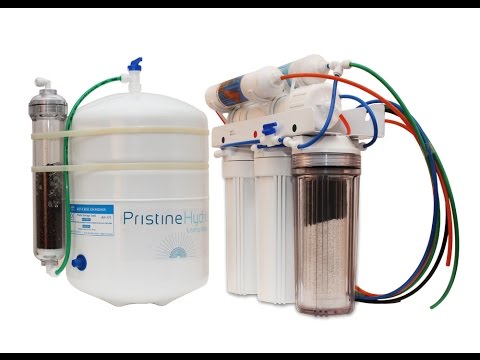
- Under-Sink Systems: A more robust setup that filters a high volume of water for all your drinking and cooking needs.
- Whole-House Systems: The ultimate home upgrade, delivering clean, filtered water to every single tap in your house.
Each of these systems is a reliable path to the crisp, clean water you deserve, without the daily headache of boiling or waiting. Now, let’s find the perfect filtration partner for you.
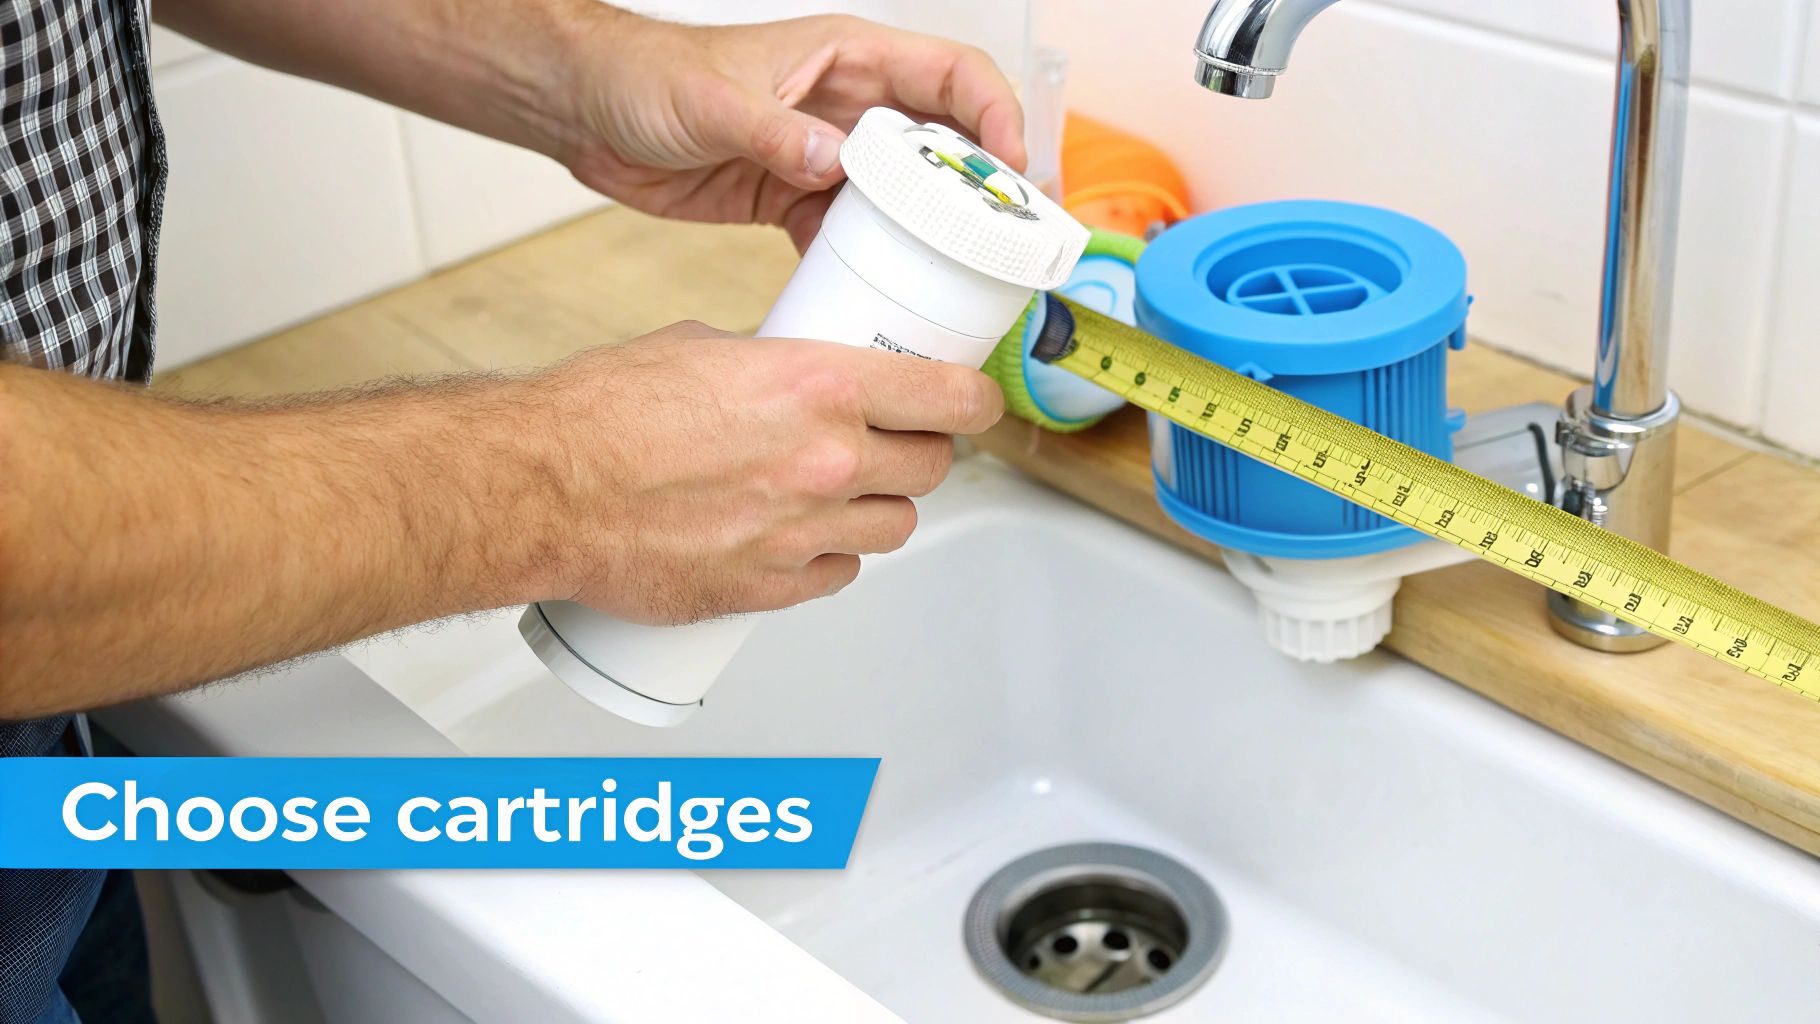
Finding the Right Water Filter for Your Home
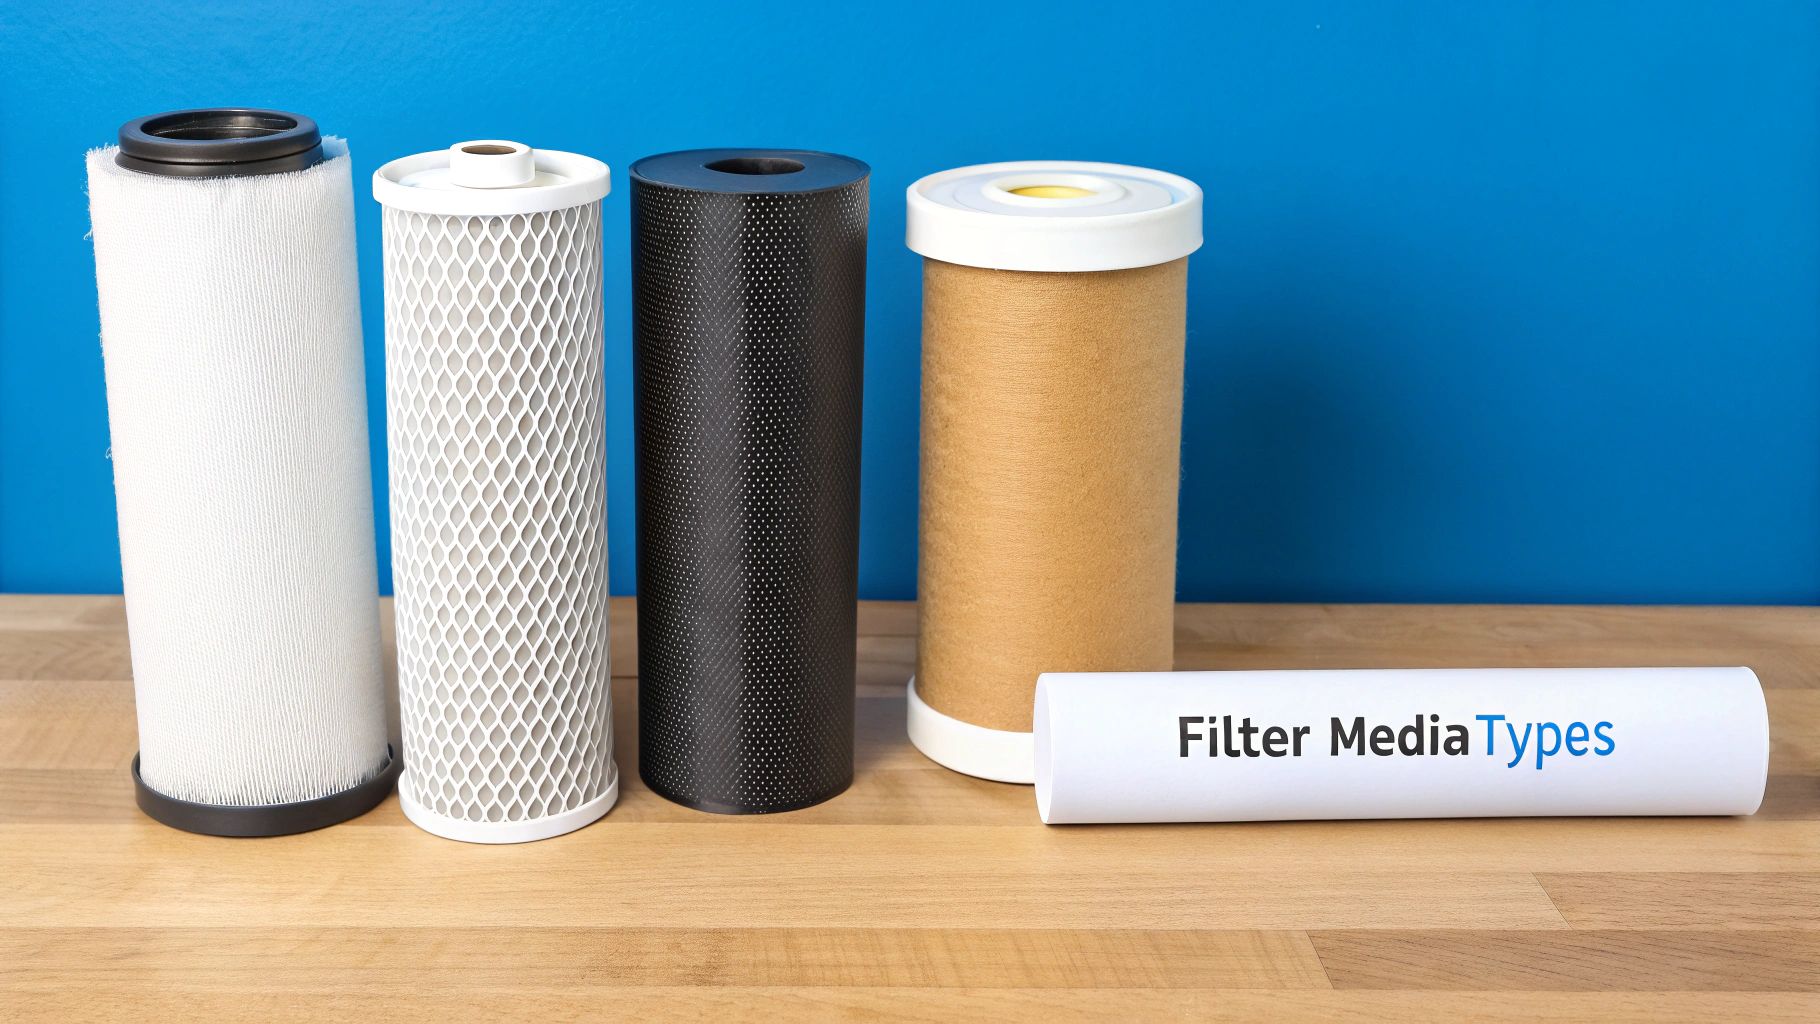
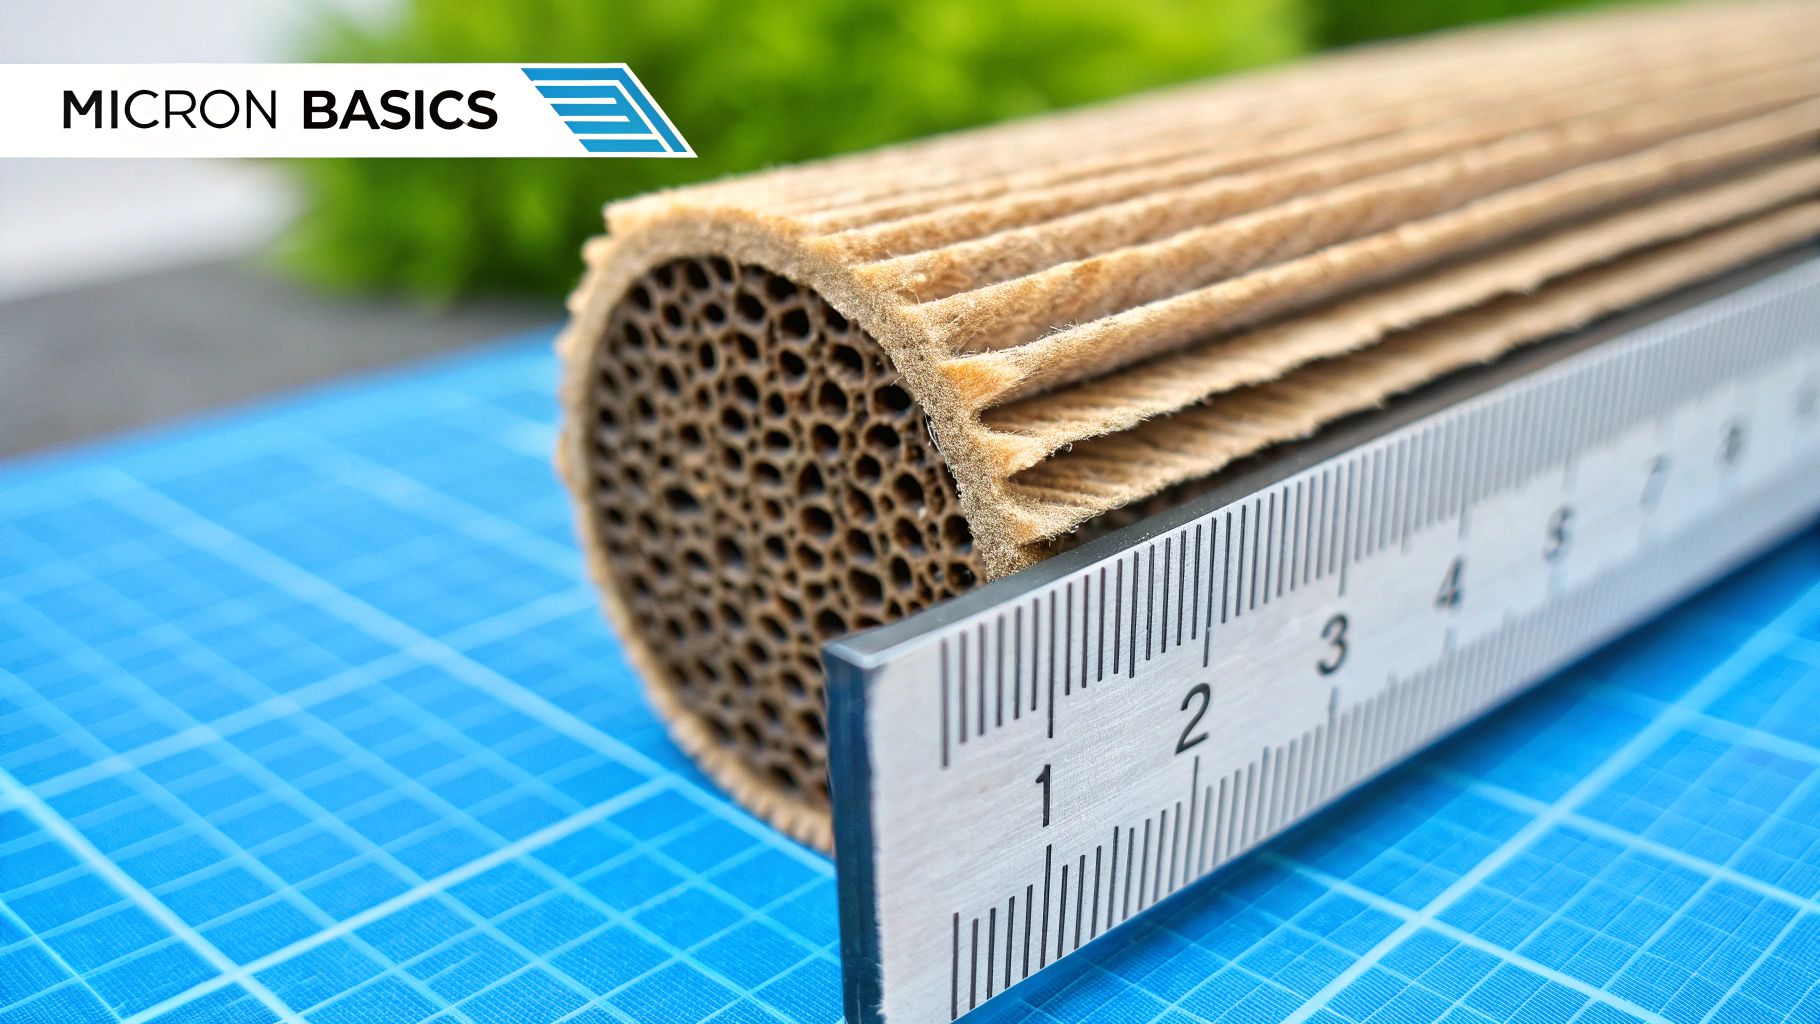
When you’re finally ready to banish that chlorine taste for good, the hero of our story is a remarkable material called activated carbon. I like to think of it as a super-powered sponge for chemicals. As water flows through it, the chlorine molecules get trapped on its massive internal surface—a process called adsorption. What comes out the other side is simply pure, fantastic-tasting water.
This elegant and effective technology is the workhorse behind most home water filters on the market. But instead of just throwing a long list of products at you, let's explore a few real-world scenarios to help you pinpoint the perfect system for your home.
Finding Your Filtration Match
The best filter for you boils down to your living situation, budget, and how much water your household uses. A solution that's perfect for a single person in an apartment likely won’t be enough for a bustling family of four.
-
For the Apartment Renter: If you're renting, you need a solution that won't make your landlord nervous. A high-quality water filter pitcher or a simple faucet-mounted filter is your best friend. They're affordable, you can set them up in minutes, and they make a night-and-day difference in the taste of your drinking water.
-
For the Small Family: An under-sink filter system is a fantastic upgrade. It stays neatly tucked away but delivers a constant stream of filtered water from a dedicated tap. This is a game-changer for filling water bottles, cooking pasta, and brewing coffee without the hassle of constantly refilling a pitcher.
-
For the Homeowner: If you own your home and you're just done with chlorine—not just in your glass but in your shower, too—a whole-house system is the ultimate investment. These systems treat every drop of water entering your home, meaning better-tasting water from every faucet and even softer skin and hair.
It can feel like a lot to process, so here’s a simple decision tree to help you visualize whether a quick fix or a more permanent solution is the right move for you.
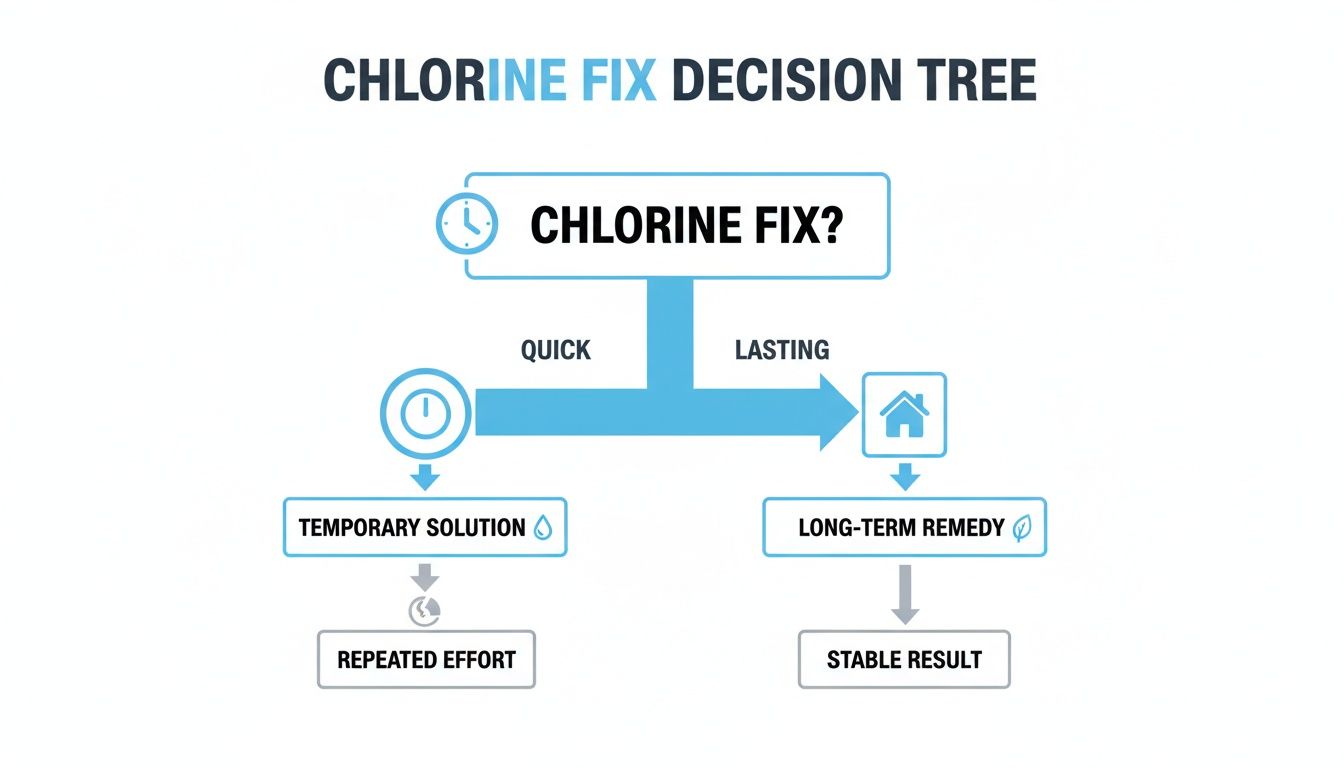
This chart helps break down the choice between immediate, temporary fixes and the more comprehensive, long-term filtration upgrades.
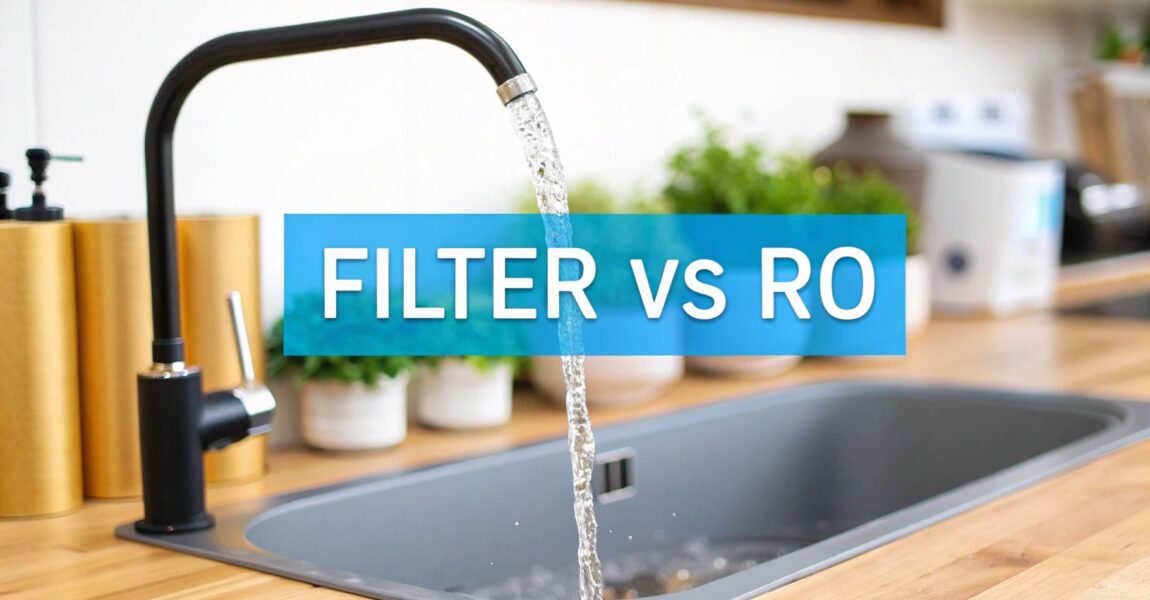
Comparing Home Water Filtration Methods for Chlorine Removal
To help you compare your options at a glance, this table breaks down the most common filtration methods. It covers everything from effectiveness to cost, making it easier to see which system lines up with your needs.
| Filtration Method | Best For | Chlorine Removal Effectiveness | Typical Cost | Maintenance |
|---|---|---|---|---|
| Water Filter Pitcher | Renters, singles, small households, or those on a tight budget. | Good (most are certified for chlorine). | $20 – $50 | Replace filter every 2-3 months. |
| Faucet-Mounted Filter | Renters or anyone wanting on-demand filtered water without plumbing. | Good to Excellent. | $30 – $60 | Replace filter every 3-4 months. |
| Under-Sink Filter | Homeowners or renters (with permission) wanting a hidden, high-volume solution. | Excellent (often removes chloramine, too). | $100 – $300 | Replace filter cartridges every 6-12 months. |
| Whole-House Filter | Homeowners looking for a comprehensive solution for all taps and showers. | Excellent (protects plumbing and appliances, too). | $500 – $1,500+ | Replace large filter cartridges every 3-5 years. |
Ultimately, the best filter is the one you’ll actually use and maintain. Each has its pros and cons, but they all rely on activated carbon to get the job done.
For a really seamless, built-in solution, you might look into products like BRITA integrated water filter taps. These offer a sleek and convenient way to get great-tasting water on demand, directly from your main kitchen faucet.
If you’re still weighing your options and need a bit more guidance, feel free to explore our other water filter advice to help you narrow down the choices.
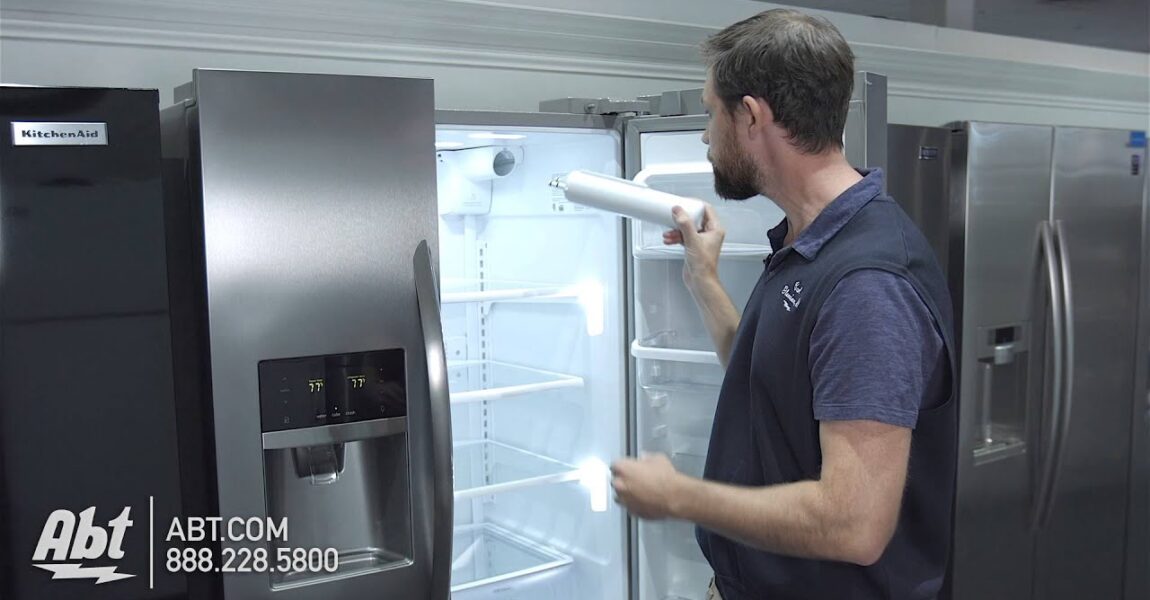
A Practical Guide to Filter Installation and Upkeep
Bringing home a new water filter shouldn't feel like a massive home renovation project. The great news is, most modern systems are designed for real people, making setup surprisingly simple.
Whether you've chosen a simple faucet filter or a more involved under-sink unit, you can often get everything up and running in under an hour with just a few basic tools from your junk drawer.
The number one rule is to follow the manufacturer's instructions to the letter. Most faucet filters just screw right on, and many under-sink systems now feature quick-connect fittings that simply snap into place. One of the most common mistakes people make is over-tightening plastic connections—a surefire way to cause cracks and leaks. Just aim for a snug fit; don't force it.
Before you even pick up a wrench, turn off the water supply to the faucet you're working on. It’s the golden rule of any DIY plumbing project and will save you from an unplanned kitchen flood.
When to Call in the Pros for Whole-House Systems
While smaller filters are perfect for a weekend DIY project, whole-house systems are a different beast entirely. These units are plumbed directly into your home's main water line, and that's a job best left to a professional plumber.
Knowing what to expect can help you understand what you're paying for. A pro will:
- Scout the Best Location: They’ll find the ideal spot on your main line, usually near the water meter, ensuring there's easy access for future filter changes.
- Handle the "Scary" Part: This involves expertly cutting the main pipe, installing bypass valves (a must-have for servicing the filter without turning off all your water), and securely connecting the system.
- Test and Double-Check: After installation, they'll flush the system, meticulously check for leaks, and make sure everything is running at the correct pressure.
Hiring a professional ensures the system works safely and efficiently without putting your home's plumbing at risk. The peace of mind alone is worth every penny for these larger systems.
The Secret to Long-Lasting Fresh Water
Once your filter is installed, your most important job is maintenance. A neglected, clogged filter can't remove chlorine effectively. Even worse, it can become a breeding ground for bacteria. Sticking to the replacement schedule is non-negotiable if you want that consistently fresh, clean taste.
So, how often do you need to swap out that filter? It really depends on the type:
- Pitcher Filters: Every 2-3 months or after filtering about 40 gallons.
- Faucet-Mounted Filters: Typically every 3-4 months or after 100 gallons.
- Under-Sink Systems: Plan on every 6-12 months, depending on your model.
- Whole-House Systems: The main carbon tank can last 3-5 years or even longer, but any sediment pre-filters will likely need changing every 6-12 months.
For those tackling an under-sink system that connects directly to your plumbing, it's really helpful to know the basics of how your faucet works. Understanding the steps for installing a kitchen faucet can give you a better feel for optimal placement and a leak-free setup.
Do yourself a favor and set a calendar reminder for your next filter change right now. It’s a simple habit that guarantees your water always tastes its best.
How to Read Labels and Choose a Filter with Confidence

Walking down the water filter aisle can be overwhelming. You're bombarded with competing claims and flashy packaging, making it tough to separate the marketing hype from real performance.
But there's a simple trick to cut through the noise: look for third-party certifications. These aren't just fancy stickers; they are your proof that a filter has been rigorously tested by an independent lab to meet specific performance standards.
Think of them as a report card for your filter. They show you it actually does what it promises on the box.
Decoding the Most Important Certification
When your main mission is to get rid of that chlorine taste, the single most important label to look for is NSF/ANSI 42. This is the certification that specifically covers "Aesthetic Effects," which includes—you guessed it—chlorine taste and odor.
If a filter is certified to this standard, it means it has passed tests proving it can effectively reduce the concentration of chlorine in your water. It’s the gold standard for confirming a filter will solve that "swimming pool" problem you're dealing with.
A product with an NSF/ANSI 42 certification is your guarantee that it has been independently verified to reduce chlorine taste and odor. Don't just take the manufacturer's word for it—look for the seal.
Understanding Other Key Labels
While NSF/ANSI 42 is your MVP for taste, you'll likely see other certifications on the packaging. It’s helpful to know what these mean, as they can help you make a more informed choice for your home's overall water quality.
-
NSF/ANSI 53 (Health Effects): This is a crucial one if you're concerned about more than just taste. It verifies that a filter can reduce specific health-related contaminants like lead, mercury, and certain pesticides. Many high-quality filters will carry both 42 and 53 certifications.
-
NSF/ANSI 401 (Emerging Contaminants): This standard tackles contaminants that are increasingly being detected in our water, like certain pharmaceuticals, detergents, and herbicides. It provides an extra layer of protection for modern water worries.
By learning to read these labels, you transform from a hopeful buyer into an informed shopper. You'll know exactly what a filter is designed to do, ensuring the product you bring home will deliver the fresh, clean-tasting water you expect. No more guesswork—just proven performance.
Frequently Asked Questions About Chlorine Removal
Even after you've landed on the perfect filter, it's natural for a few more questions to surface. We get it. You want to be absolutely sure you’ve made the right call.
Let's tackle some of the most common questions we hear from people who are ready to upgrade their water. Think of this as the final piece of the puzzle to help you feel totally confident in your choice.
Chlorine vs. Chloramine: What's the Big Deal?
This is a huge one, because the difference really matters for filtration. A standard activated carbon filter is a champion at removing chlorine, but it struggles when it comes to chloramine.
What is chloramine? It’s a more stubborn disinfectant that some water municipalities create by mixing chlorine with ammonia. They use it because it's more stable and lasts longer as it travels through the pipes to your home.
If your city uses chloramine, your basic carbon filter just won't cut it. You'll need to upgrade to a system that uses catalytic carbon. This is a special type of carbon engineered specifically to break the tough chemical bond in chloramine, which is the only way to effectively eliminate its taste and smell.
Will I Filter Out the Good Minerals Too?
It’s a classic concern: in getting rid of the bad stuff, are we also ditching the good? For most chlorine filters, the answer is a relieving "no."
- Activated and Catalytic Carbon: These filters are smart. They’re designed to adsorb chemicals like chlorine and organic compounds, but they let beneficial minerals like calcium, magnesium, and potassium sail right on through.
- Reverse Osmosis (RO): Now, this is the exception. RO is an incredibly fine filtration process that strips out nearly everything—including those healthy minerals. The good news is that many modern RO systems have solved this by including a remineralization stage to add a balanced mix of essential minerals back in before the water ever hits your glass.
The takeaway is simple: a good carbon filter gets you the clean taste you want without stripping the water of the minerals your body needs. It’s the best of both worlds.
Why Does My Shower Smell So Much Like a Pool?
Ever step into a hot shower and feel like you've been hit with a wave of chlorine smell, far stronger than what you notice from the tap? You're not imagining it.
When you heat chlorinated water, the chlorine can vaporize into a gas (chloroform), which you then inhale. That's why your bathroom can suddenly smell like the local rec center. This isn't just unpleasant; it's also a common culprit behind dry, itchy skin and brittle hair.
A simple showerhead filter is a fantastic and affordable fix. These easy-to-install devices typically use a mix of carbon and another media called KDF (Kinetic Degradation Fluxion), which is especially effective at neutralizing chlorine in hot water. It’s a small change that can make a world of difference for your skin, hair, and overall shower experience.
At Water Filter Advisor, our mission is to provide clear, practical information to help you get safer, better-tasting water for your home. Dive into our expert guides and find the right solution for your family at https://www.waterfilteradvisor.com.